
Around the age of 35, despite good training, it becomes more challenging to maintain performance levels in old age. In this article, we look at how age influences athletic performance and whether the decline in performance accelerates with age.
This article examines how athletic performance, especially in marathon running, changes with age, focusing on athletes over 40 years old.
Using data from world records in the Masters categories and the running.COACH database, we have analyzed the marathon times of the fastest representatives of age groups worldwide as well as those of amateur athletes and their development across age categories.
The results show a relatively linear decline in performance in both groups, with significant performance declines (“bends” in the performance curves) appearing earlier in amateur athletes than in elite runners, suggesting that intensive training can delay the onset of rapid performance decline even in older age.
At the end of the article, we also show the approximate extent of the annual decline in performance.
Performance Development of Top Athletes Over the Years
To understand how marathon runners’ performances change with age, we examined the world records in the Masters categories. These records represent the fastest marathon times ever achieved in various age groups.
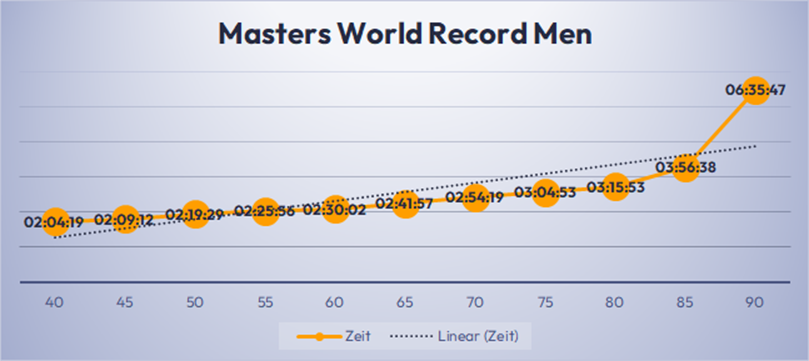
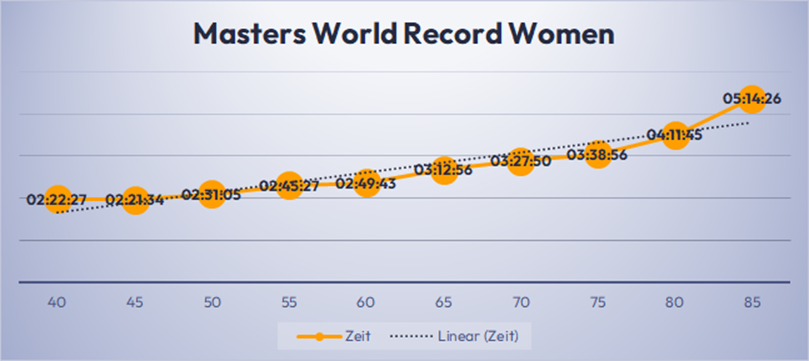
Fig: The Masters world records over the marathon distance in the various age groups for men (top) and women (bottom).
The analysis reveals that performance decline occurs relatively evenly with age for both men and women.
The consistency of performance decline varies slightly between genders. For men, performance loss ranges from 3% to 7% until M80, while for women, there is a sudden drop of 12% between W60 and W65.
For both genders, a significant “bend” in the curve can be observed at a certain age category. While this accelerated performance decline in men occurs only at the M80-M85 transition (17% slower time), it is evident in women already at the W75-W80 transition (13% slower time).
In summary, we can state the following:
- General Trend: Performance decline in marathon runners follows a relatively linear pattern for both genders until old age.
- However, minor differences between genders are noticeable. The “bend” and thus the break with the linear decline occurs somewhat earlier in women than in men.
*The M40 age category includes runners aged 40-44 years.
Performance Development of Amateur Athletes Over the Years
To see if performance development in amateur runners follows a similar pattern to elite athletes, we analyzed results from the running.COACH database. Initially gender-neutral, we identified the fastest average time among all running.COACH community members within an age category to compare with the Masters world records (Average RC). For example, in the 40 age group (40-44 years old), the 42-year-old runners had the fastest average time of 03:27:55 in our database.
We also identified the fastest time within an age category (Fastest RC). It should be noted that we only have informative data available up to the 70 age category.
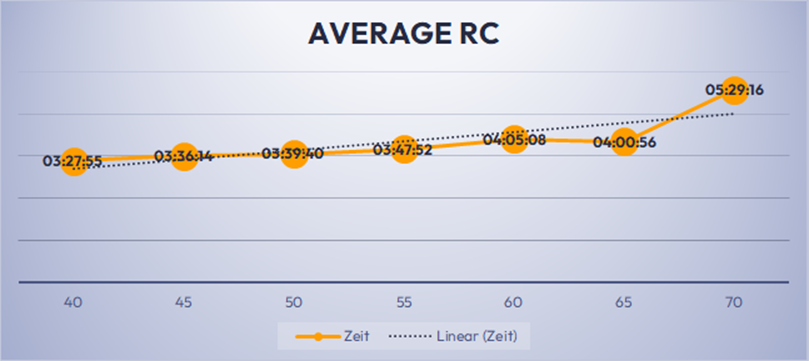
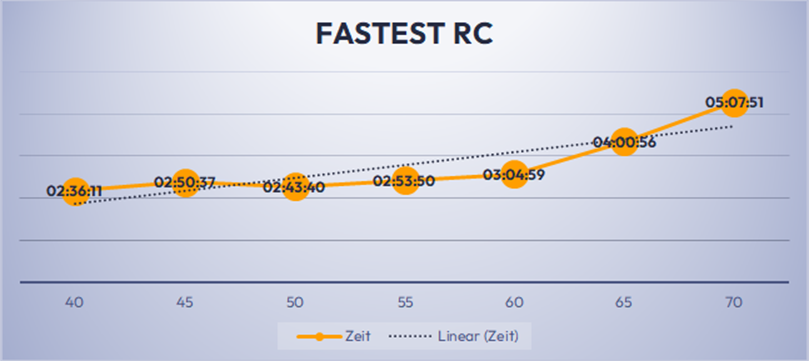
Fig: The development of the average marathon times of running.COACH community members with increasing age. The average fastest year was chosen to represent the age category.
The following results were observed:
The analysis shows that average times exhibit a similar linear trend as world records.
However, there is a greater performance decline of 7% when transitioning from the 55 to 60 age category, compared to a maximum of 4% in younger categories. Additionally, the “bend” in the performance curve, indicating a significantly stronger decline, is already noticeable at 70 years old, about 10-15 years earlier than in world record times.
Of particular interest is the comparison between average times and fastest times: while the “bend” in average times occurs between 65 and 70 years old, it is already observable 5 years earlier in the fastest times of the running.COACH community.
Performance Curve in running.COACH Men
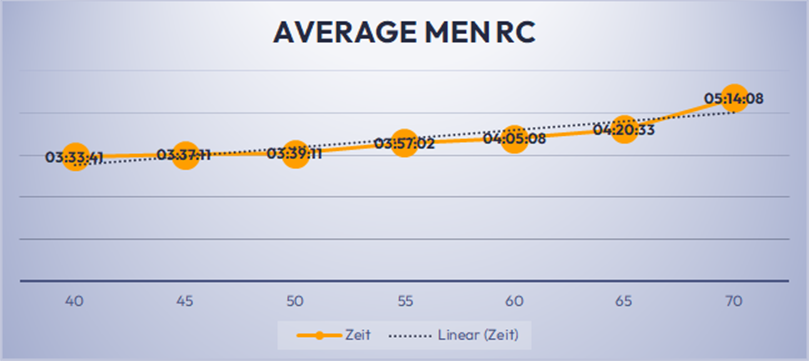
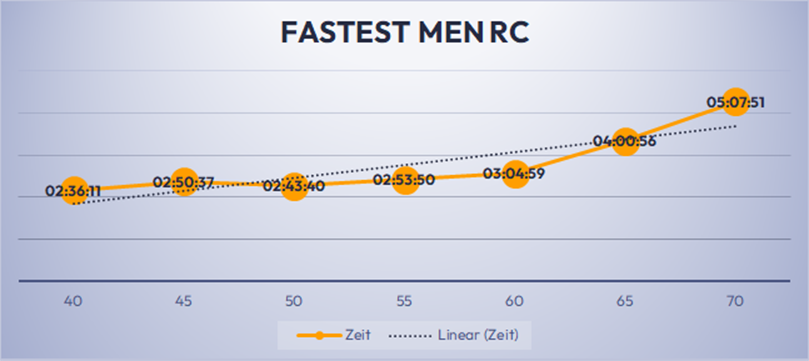
Fig: The development of the average marathon times of running.COACH community male members with increasing age (top) and the fastest times (run by an individual athlete) in the corresponding age group (bottom).
The curve for running.COACH men behaves similarly to the gender-neutral values. However, while the first deviation from linear development was observed between 55 and 60 in the latter, this step can already be observed between 50 and 55 for the men (8% performance loss).
The pronounced “bend” in the performance curve, indicating a stronger decline, is noticeable in the average values of men between 65 and 70 years old. However, it is less pronounced than in the fastest times and occurs five years later compared to the fastest running.COACH times.
Since the fastest times within age categories were achieved by male athletes, this curve is identical to the one described above (Fastest RC). The fastest times show a flatter curve, with a performance decline from M45 to M55 of only 2%.
Performance Curve in running.COACH Women
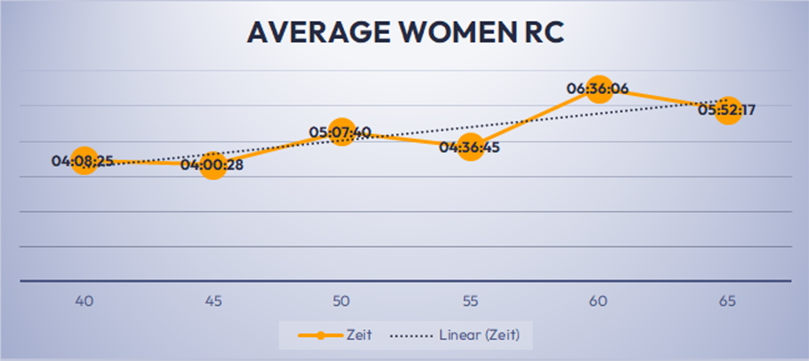
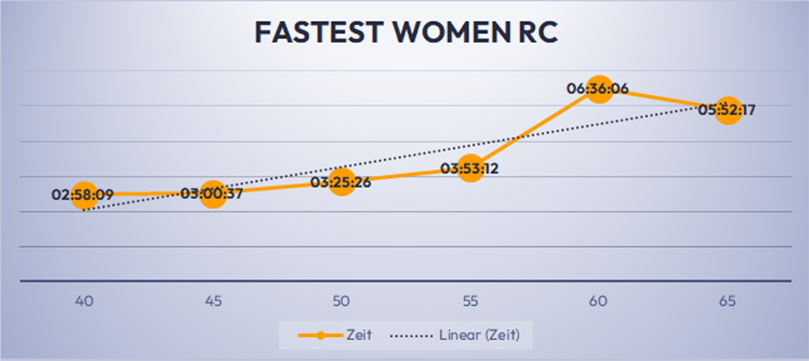
Fig: The development of the average marathon times of female running.COACH community members with increasing age (top) and the fastest times (run by an individual athlete) in the corresponding age group (bottom).
It should be noted here that the data for women is not as extensive as for men, which may result in some outliers in the values.
However, comparing the fastest determined average time (M40 for men, W45 for women) with the time in the 55 category, the decline is 10% for men and 14% for women. While the decline is greater for the latter, it corresponds exactly to the same decline observed in world record times. There, the percentage decrease in performance from 40-year-olds is 15% for men and 14% for women.
The development of the fastest times in the age groups is much more linear for running.COACH women. The effect that is evident in the world record times between the genders can also be observed. Namely, the so-called “kink” (between 55 and 60) can be observed somewhat earlier than for men.
Performance Curve in Winners of the SwissCityMarathon 2023
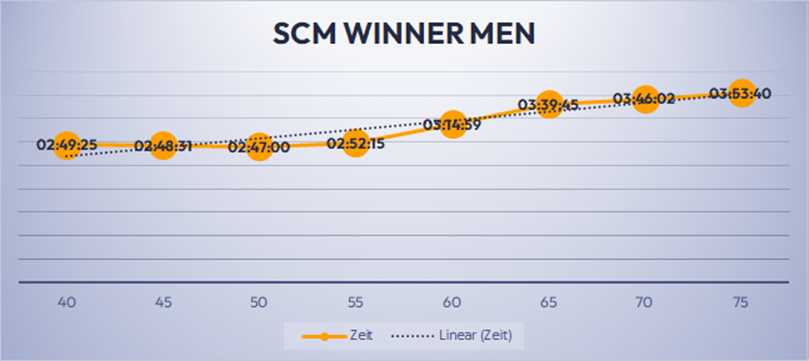
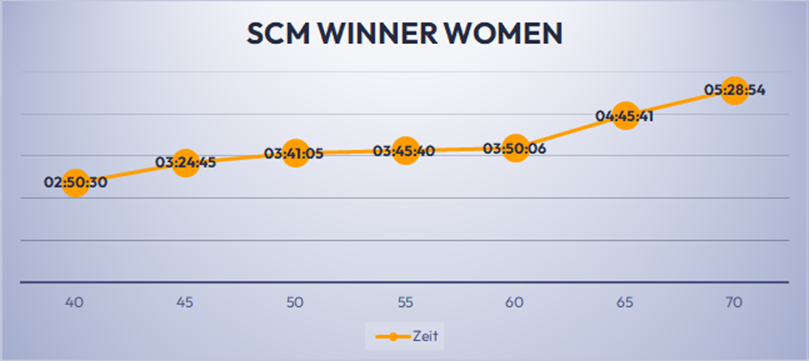
Fig: The winning times in the age categories of the SwissCityMarathon 2023.
For male winners in the age categories of the SwissCityMarathon, it is noticeable that the curve between 40 and 55 shows almost no incline, indicating extremely consistent performances. The “bend”, however, is noticeable slightly earlier (at 60) than in male marathon runners in running.COACH (with comparable fastest time of the 55-year-olds).
For women, there is a significant incline between categories 40 and 45. However, this may also be attributed to the extremely strong winning time in the W40 category. After that, the development between 45 and 60 is linear, before the “bend” of increased performance decline is observable at the transition to 65. While the “bend” in world records and running.COACH occurs earlier in women, it was later observed in participants of the SCM compared to their male counterparts. However, it should also be noted that the number of participants decreases significantly with age, and therefore, the data should be viewed with caution.
Conclusion
In summary, the following conclusions can be drawn from this analysis:
- Performance decline with age follows a linear pattern up to a certain point (referred to as the “bend”), beyond which the process accelerates.
- This “bend” is observed much later in world record times compared to the times observed in amateur athletes. This suggests that intensive training in advanced age can delay accelerated performance decline.
- The annual performance decline until the bend averages 1.14% per year for male world record times, while for recreational sports, the decline is 1.11% (SwissCityMarathon) and 0.85% (running.COACH), which is lower for the latter group.
- Conversely, the annual performance decline until the bend is higher for women. Here, the average annual performance decline in world records is 1.23%. For amateur athletes, these values are 1.51% (SCM) and 1.81% (running.COACH).
- In general, it can be assumed that the annual decline until the bend is slightly higher for women on average compared to men. The values in recreational sports can be estimated at approximately 1% average decline per year for men and about 1.5% for women.
Create a personalized and dynamic training plan with running.COACH to prepare you for your running goals, based on your current fitness level. Try running.COACH free for two weeks after your first sign-up!